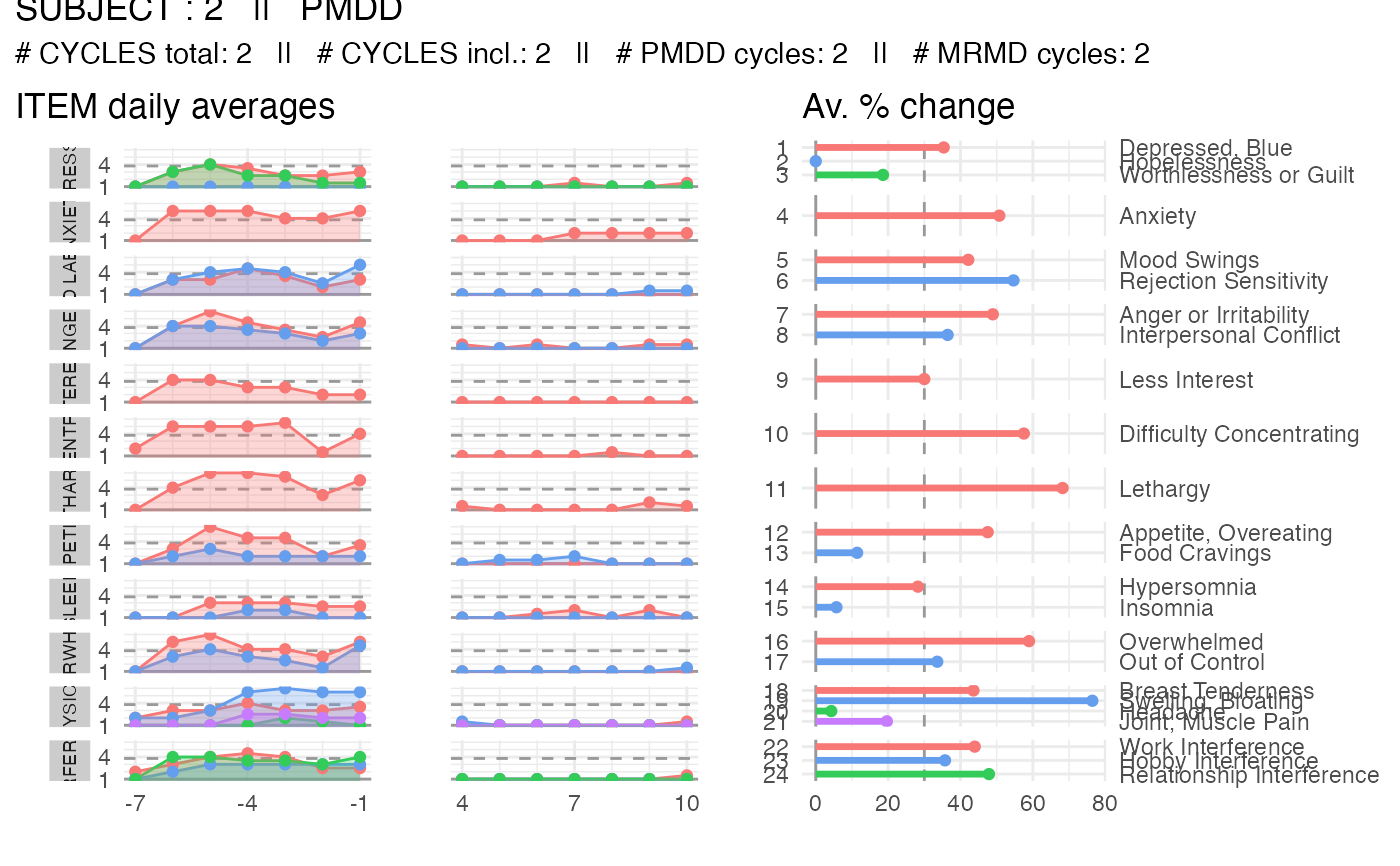
Visualize the subject diagnosis
plot_subject_dx.RdThis function calls the CPASS function and
provides a visualization of the diagnosis.
Usage
plot_subject_dx(
  data = data.frame(),
  color_summary = c("complementary", "rainbow")
)
Arguments
- data
a
cpassdata frame (useas_cpass_datato convert your data intocpassdata) that contains the symptoms reported by ONE subject.- color_summary
string. Either
"complementary"(default) or"rainbow"specifying the type of color scheme for the ITEM items in the diagnosis summary. If"complementary", the colors are chosen complementary within a domain; if"rainbow", the DRSP items colors are different for each item and chosen from a rainbow palette.
Examples
library(magrittr)
library(dplyr)

data(PMDD_data)
input <-
  PMDD_data %>%
  dplyr::filter(subject == 2) %>%
  as_cpass_data(., sep_event = "menses")
#> Number of subjects:  1
#> Total number of cycles:  2
#> Percentage of missing scores:  13.1 %
#> Warning: The 'phase' column will be over-written
#> Percentage of missing scores
#>           (in pre- & post-menstrual phases):  13.1 %
plot_subject_dx(data = input)