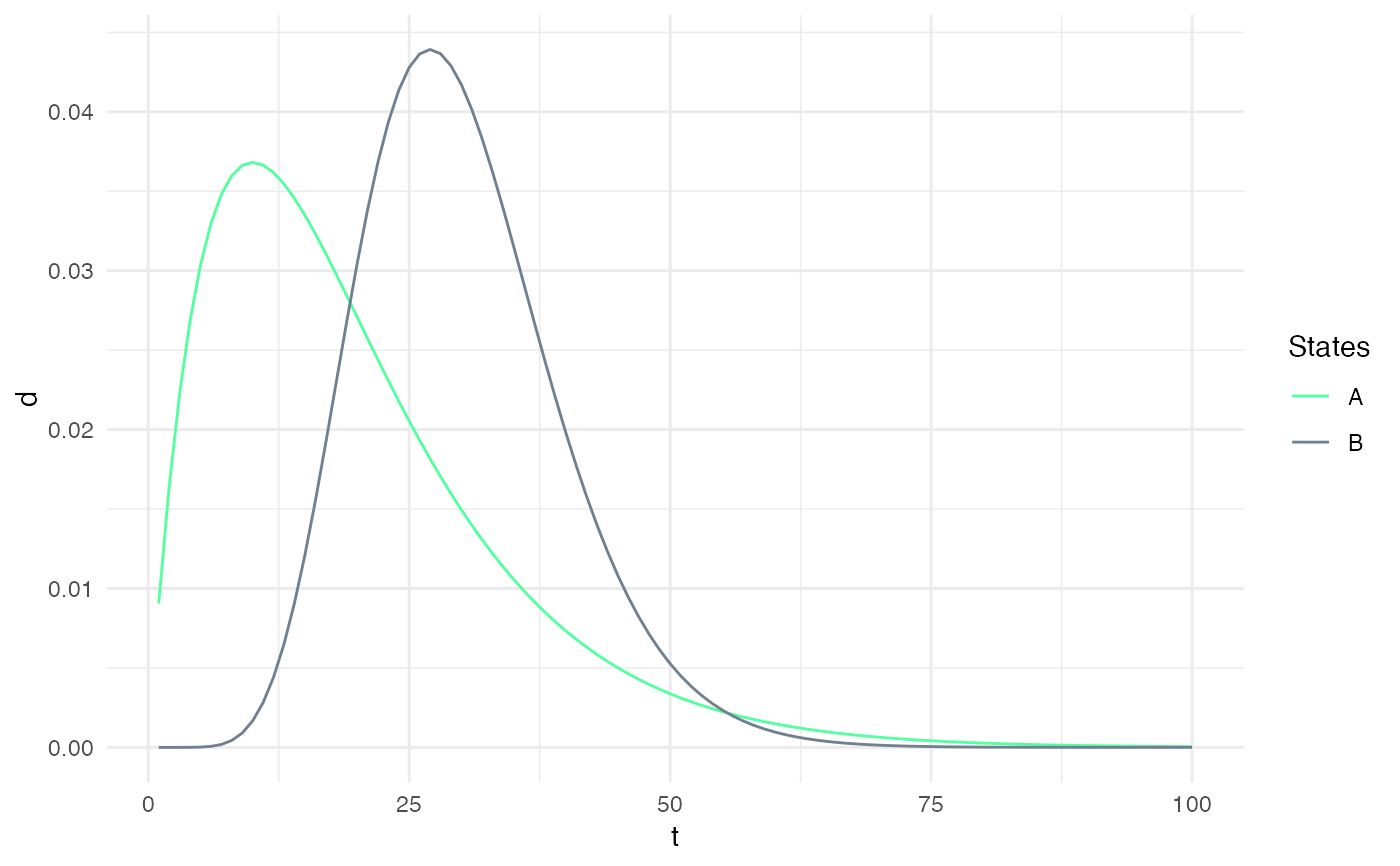
Visualizes the sojourn distributions of a hidden semi-Markov model.
plot_hsmm_sojourn_dist.RdVisualizes the sojourn distributions of a hidden semi-Markov model.
plot_hsmm_sojourn_dist(model, maxt = 100, one_panel_per_state = FALSE)
Arguments
| model | a |
|---|---|
| maxt | (optional) an |
| one_panel_per_state | (optional) a |
Value
a ggplot object.
Examples
my_model = simple_model
plot_hsmm_sojourn_dist(model = my_model)