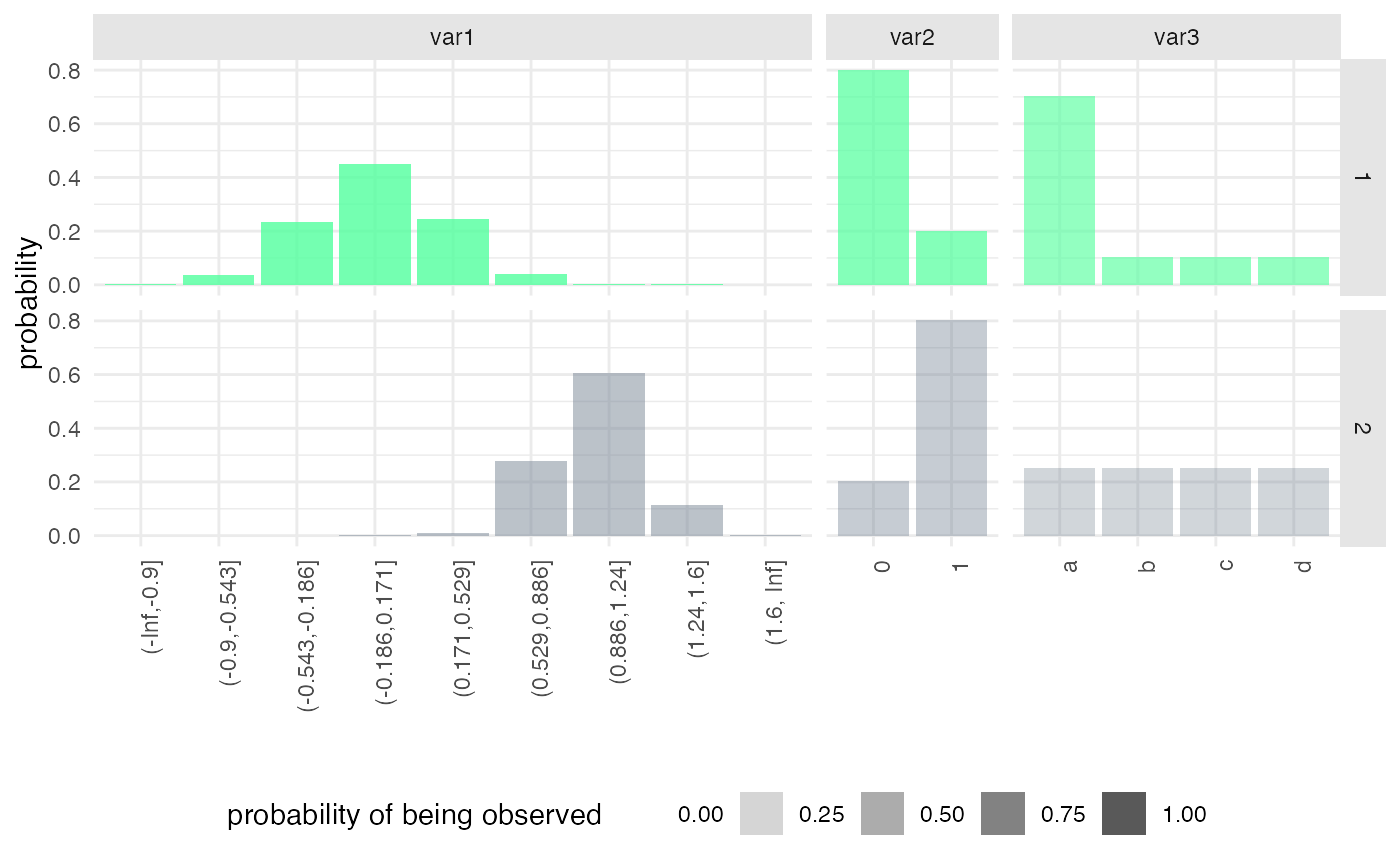
Visualizes the marginal emission distribution of a hsmm model.
plot_hsmm_marg_dist.RdVisualizes the marginal emission distribution of a hsmm model.
plot_hsmm_marg_dist(model, show_missing_probs = TRUE, verbose = FALSE)
Arguments
| model | a |
|---|---|
| show_missing_probs | (optional) a |
| verbose | (optional) a |
Value
a ggplot object.
Examples
my_model = simple_model
plot_hsmm_marg_dist(model = my_model)