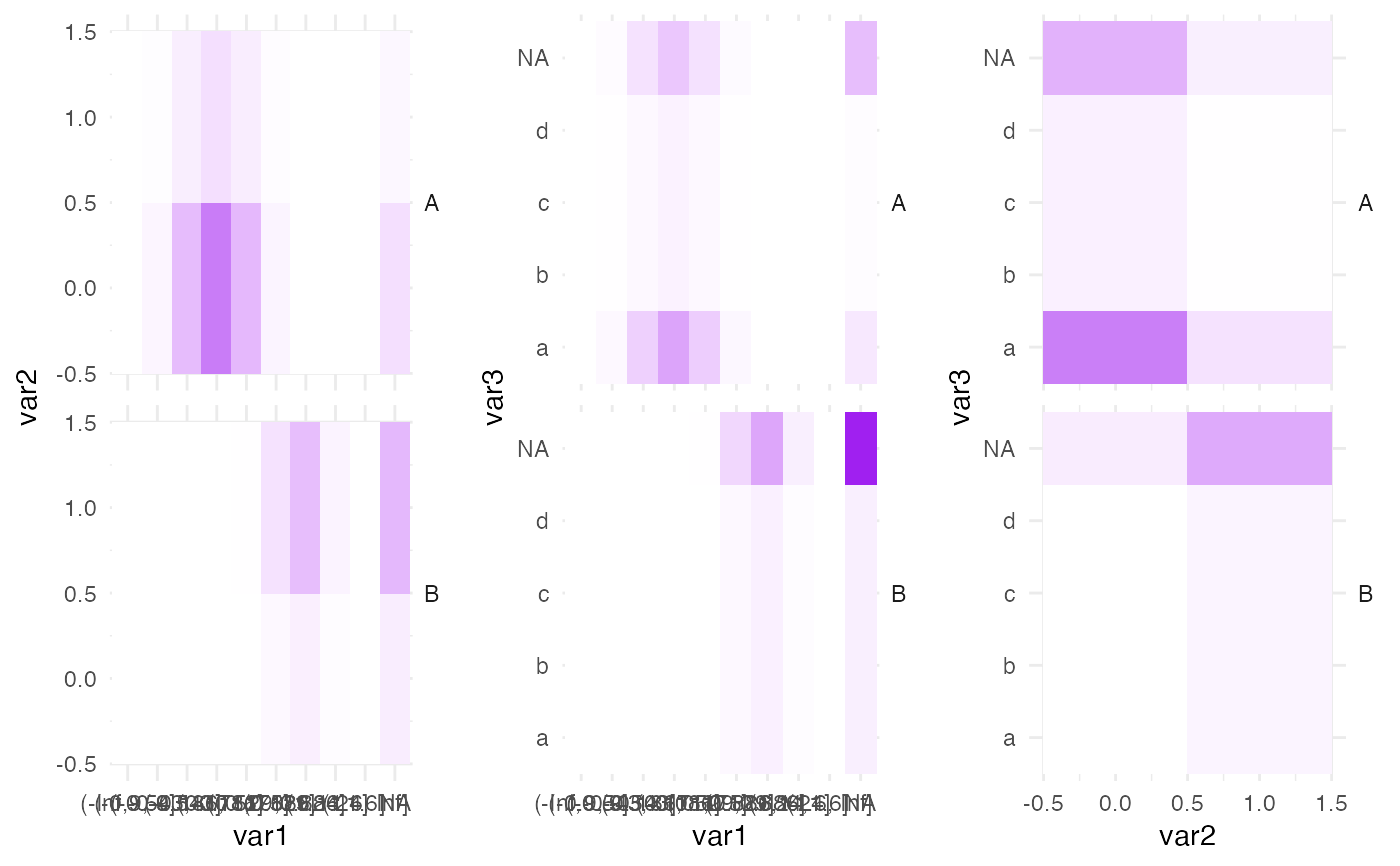
Visualizes the joint emission probabilities (2x2) of a hidden semi-Markov model.
plot_hsmm_joint_em_prob.RdVisualizes the joint emission probabilities (2x2) of a hidden semi-Markov model.
plot_hsmm_joint_em_prob(model, title = "")
Arguments
| model | a |
|---|---|
| title | (optional) an character specifying the title of the visualization (typically the name of the model). By default, there is no title. |
Value
a ggplot object.
Examples
my_model = simple_model plot_hsmm_joint_em_prob(model = my_model)#> Warning: Removed 20 rows containing missing values (geom_tile).#> Warning: Removed 10 rows containing missing values (geom_tile).