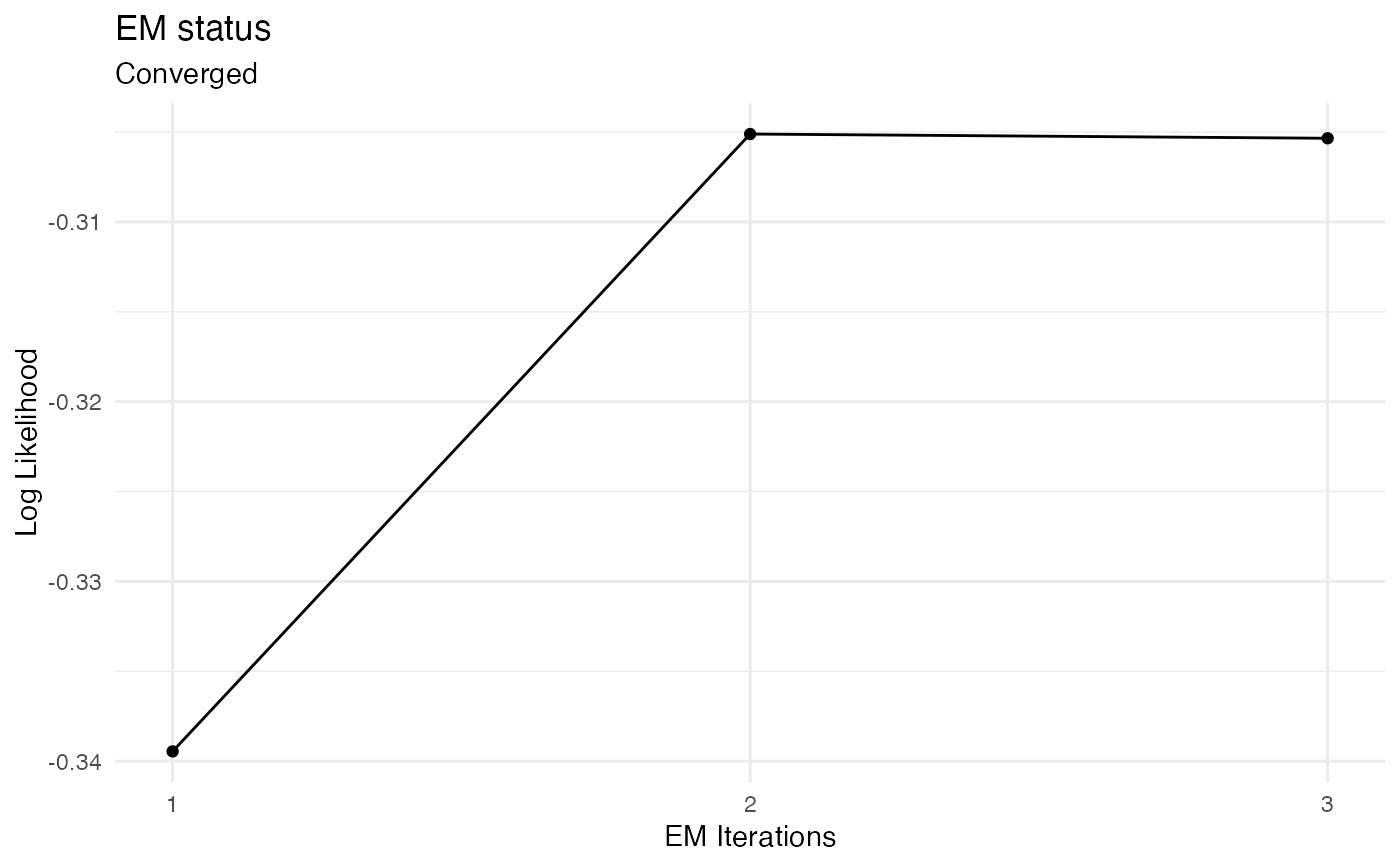
Visualizes the status of the EM-procedure.
plot_hsmm_fit_status.RdIf a model has been fitted using the function fit_hsmm(), this function can be used to visualize the convergence of the EM.
plot_hsmm_fit_status(fit_output, title = NULL, y_axis_limits = NULL)
Arguments
| fit_output | the output of the |
|---|---|
| title | (optional) an character specifying the title of the visualization (typically the name of the model). By default, there is no title. |
| y_axis_limits | (optional) a 2-element vector specifying the limits of the y-axis. |
Value
a ggplot object.
Examples
my_model = simple_model
X_sim = simulate_hsmm(model = my_model, n_state_transitions = 20)
fit_results = fit_hsmm(model = my_model, X = X_sim)
plot_hsmm_fit_status(fit_output = fit_results)